
Strength Dashboard
RSI 14 on the chart plus a dashboard that scores up to six timeframes and weights them into one overall bias.
Illustrative graphic only. Not real market data.
OverviewWhat it does
RSI 14 on the chart plus a weighted multi-timeframe dashboard. Each timeframe is scored from RSI, MACD, STC and a trend EMA, using completed candles only.
New to the readings behind it? Read the Learn guide on multi-timeframe bias.
FeaturesWhat is inside
RSI on the chart
RSI 14 with overbought and oversold levels (70 / 30 by default), optional cross labels and an optional background highlight.
Per-timeframe scores
Each included timeframe is scored from -10 to +10 using RSI, the MACD histogram, the Schaff Trend Cycle (STC) and a trend EMA.
Weighted overall bias
You set how much each timeframe counts. The weighted average gives the Overall bias, and weights are re-scaled so they do not need to add up to 100.
Choose your timeframes
Include or leave out 15m, 30m, 1H, 4H, Daily and Weekly rows.
Completed candles only
Higher-timeframe scores use completed candles, so they do not change while a higher-timeframe candle is still forming.
Compact or detailed dashboard
A navy and gold table you can move and resize, with a compact view or a detailed view that shows RSI, MACD, STC and trend for each row.
On your chartWhat you will see
- RSI lineRSI 14 with overbought and oversold levels
- DashboardOne row per timeframe with RSI, MACD, STC, trend, score and bias
- Bullish rowsRows that score above zero
- Bearish rowsRows that score below zero
The overall bias summarizes indicator readings across timeframes for study. It is not a forecast.
Illustrated examplesWhat it looks like on a chart
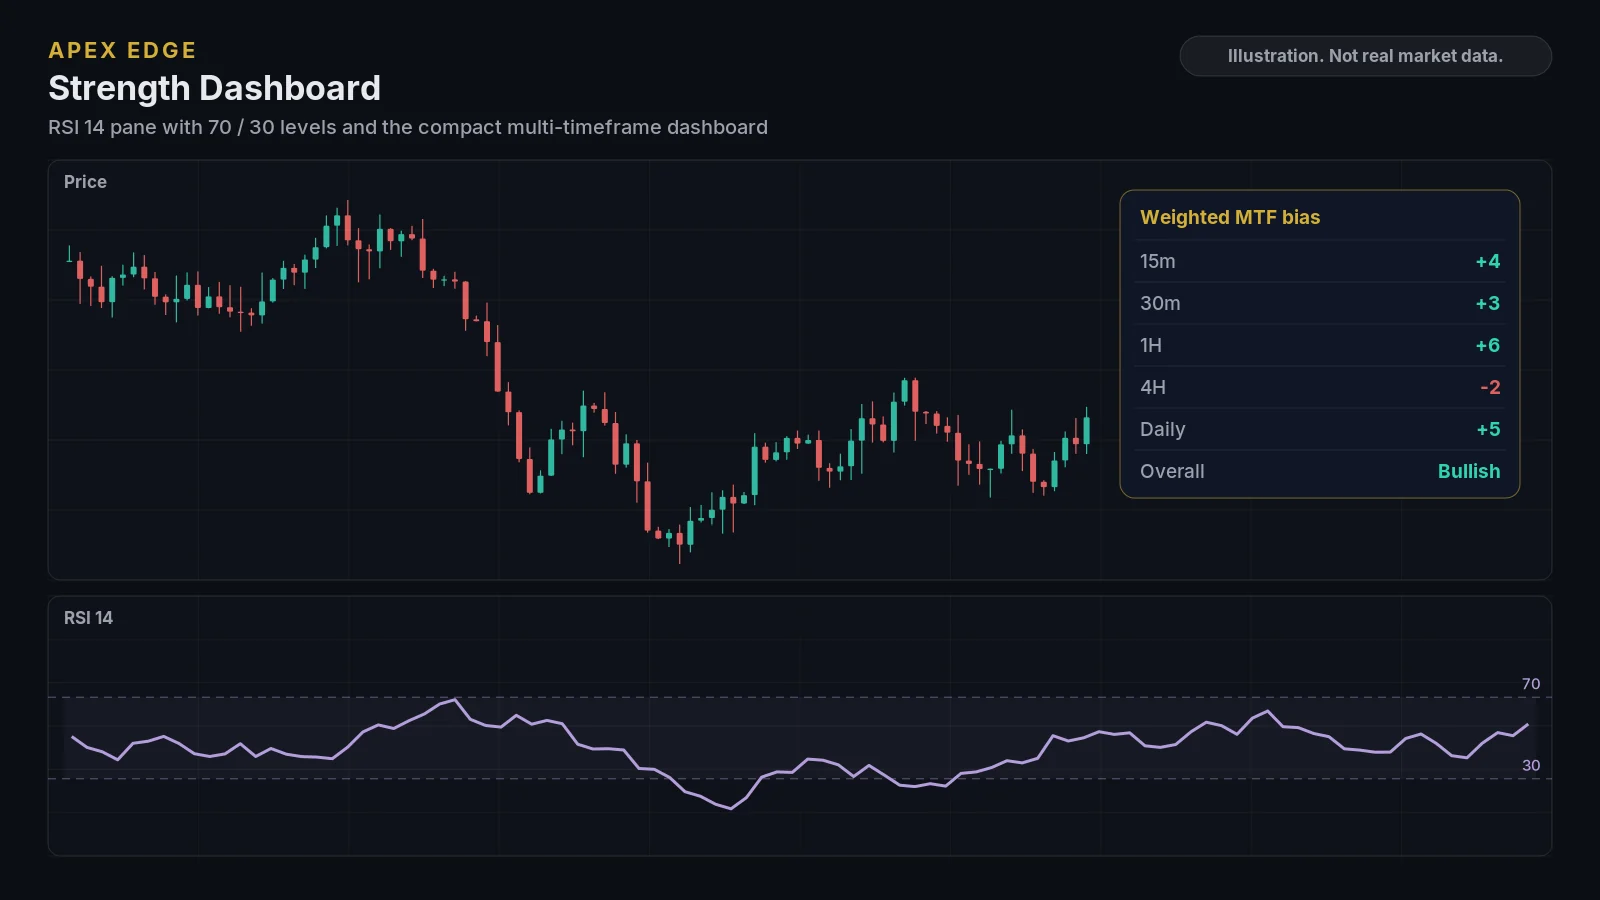
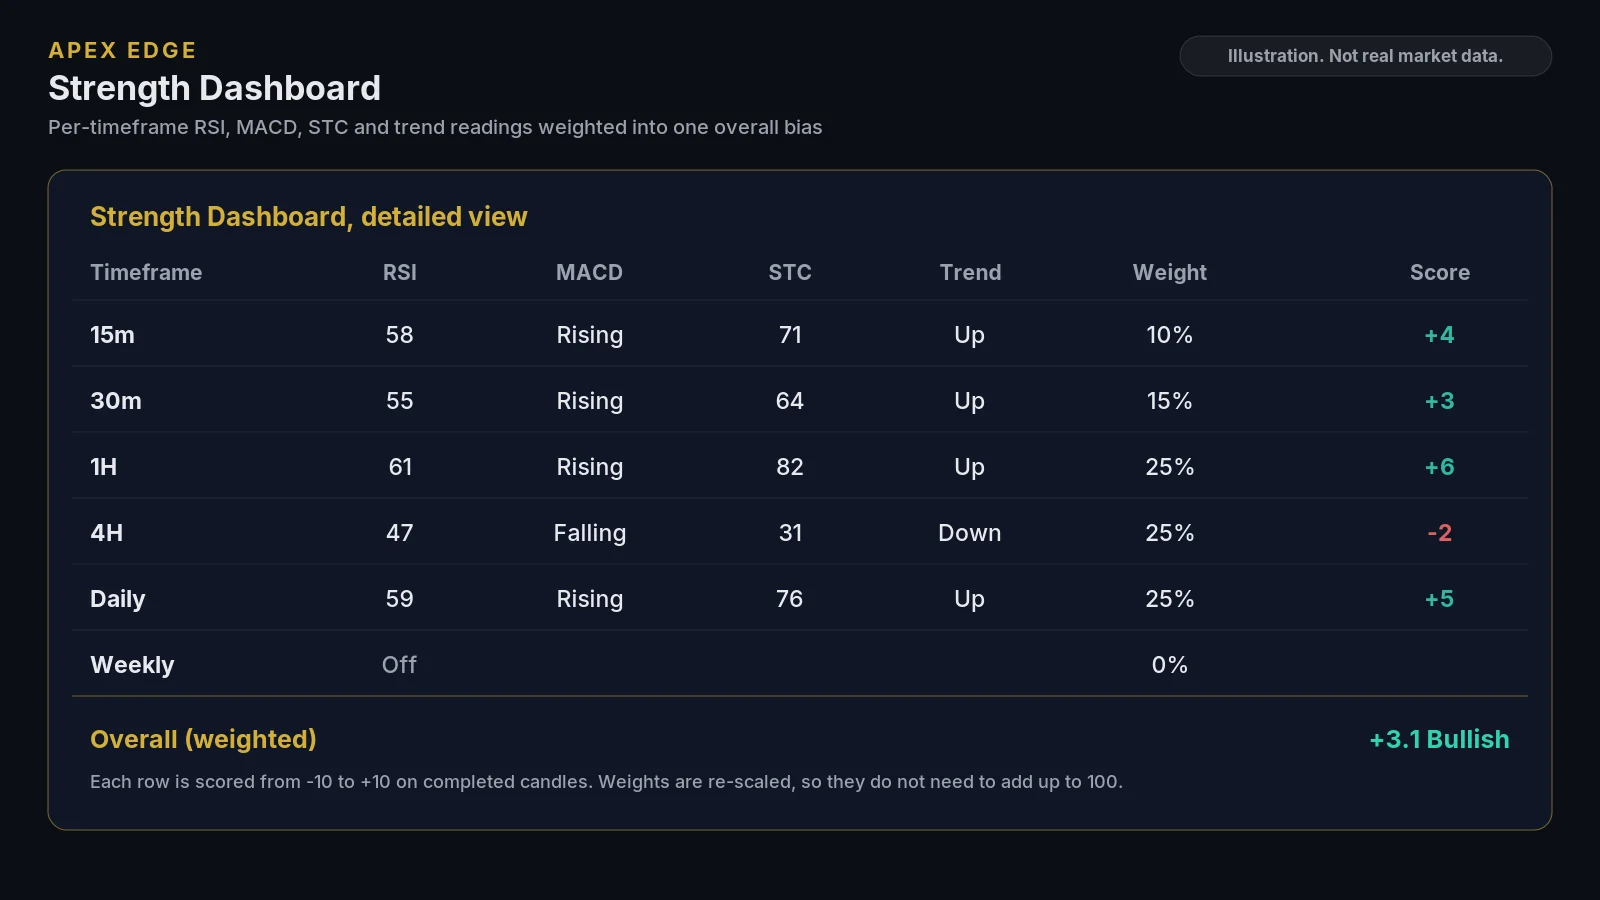
Illustrations drawn from sample data to show the layout. They are not real market data or TradingView screenshots. Education only, not personal advice.
Where to use itRecommended timeframe and markets
Any market, any timeframe
Works on any market. The dashboard can include the 15-minute, 30-minute, 1-hour, 4-hour, Daily and Weekly timeframes (Weekly is off by default), and each one reads completed candles only.
- The dashboard summarizes indicator readings for chart study. It is not a forecast or a trade recommendation.
AlertsBuilt-in TradingView alerts
- RSI crossed above overbought or below oversold
- RSI moved back below overbought or above oversold
- Overall bias changed to strong bullish or strong bearish
- 6 alert conditions in total
Alerts are created from the TradingView alert dialog. Alert availability depends on your TradingView plan.
CustomizeSettings you can adjust
- RSI length, source and overbought / oversold levels
- MACD lengths
- STC cycle, lengths, smoothing and levels
- Trend EMA length
- Which timeframes are included and their weights
- Labels, background highlight, dashboard view, position and size
Before you subscribeRequirements
- A TradingView account (TradingView is a third-party platform and is not affiliated with Apex Edge).
- Your TradingView username, entered at checkout, so access can be added to your account.
- A charting tool only: it does not place orders or connect to your broker.
Keep exploringOther indicators
Put clearer structure on your TradingView charts
Pick the indicators you need or take them all. Cancel any time on Whop, and learn how everything works for free in our lessons first.