
Trend Path
Draws a volatility-adjusted trailing path that stays on one side of price until a candle closes through the band, then the path flips.
Illustrative graphic only. Not real market data.
OverviewWhat it does
A trailing path colored by direction, with a fixed or Auto ATR-percentile width, optional fill and turn markers, and an optional higher-timeframe path from that timeframe's last completed candle.
FeaturesWhat is inside
Chart path
Colored by whether it is trailing below price (up) or above price (down).
Close-through flip
The path stays on one side until a candle closes through the band, then it flips.
Fixed or Auto width
A fixed ATR multiple, or Auto steps between quiet, normal and expanded multipliers from the ATR percentile.
Optional fill and turn markers
Fill between the path and close, and UP / DN markers on the close that turns the chart path.
Optional higher-timeframe path
A second path from a higher timeframe (default 4 hour).
Branded dashboard
Path direction, current multiplier, ATR percentile, Auto step, and the higher-timeframe direction.
On your chartWhat you will see
- Up pathThe path trailing below price
- Down pathThe path trailing above price
- Turn markerAn UP or DN marker on the close that flips the path
- HTF pathOptional higher-timeframe trailing path
The path flips only after a candle closes through the band. The path is a map of direction for study, not a trade instruction.
Illustrated examplesWhat it looks like on a chart
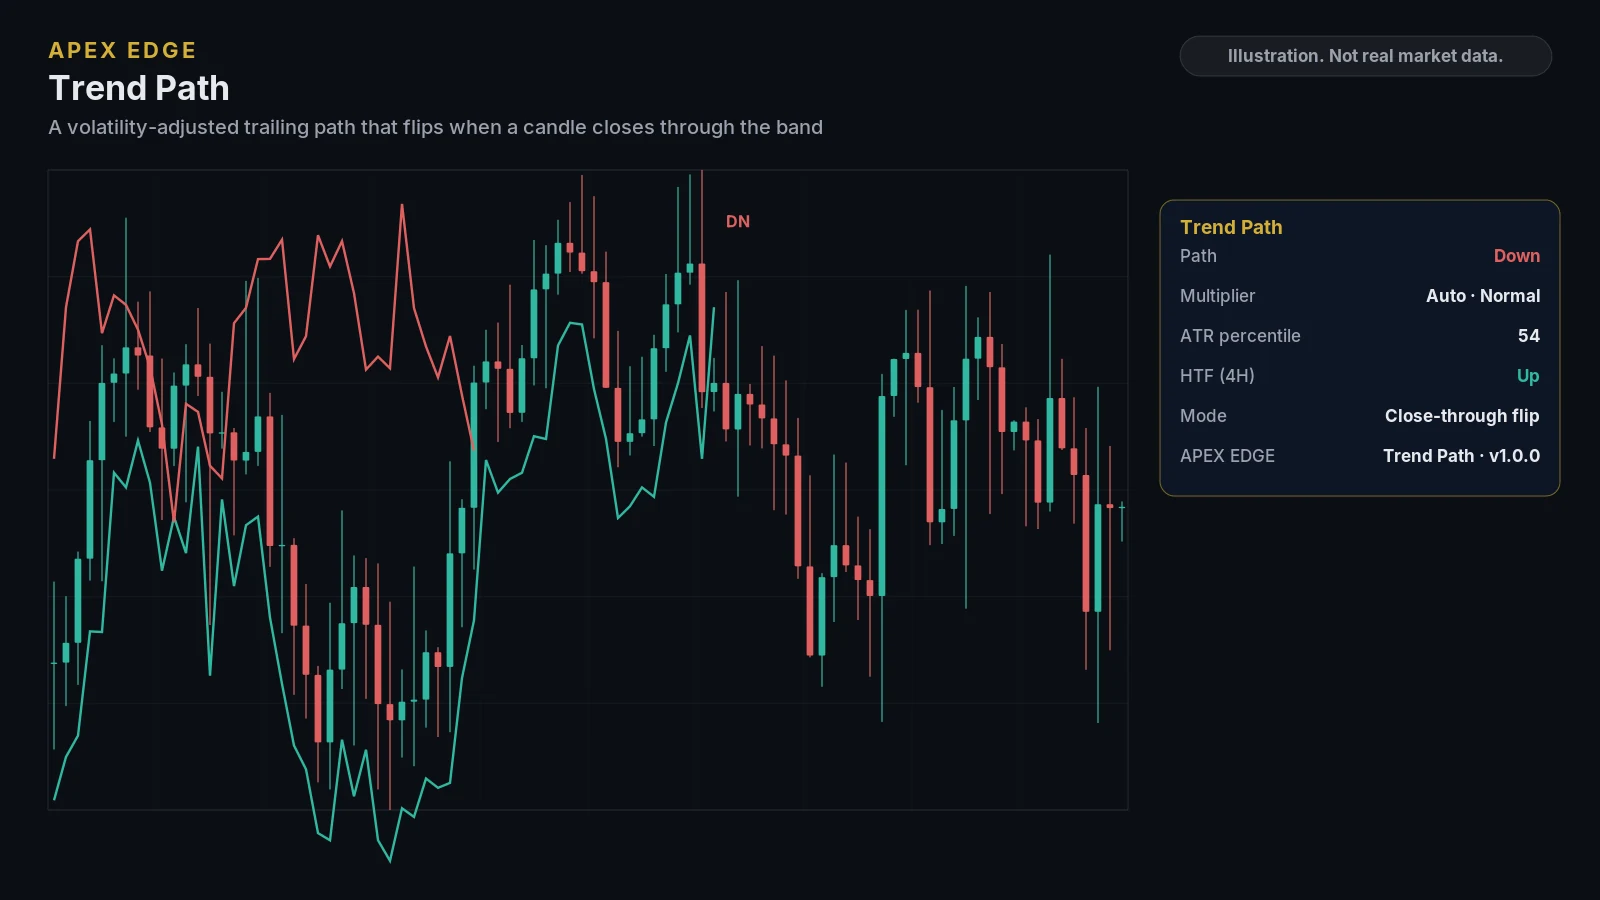
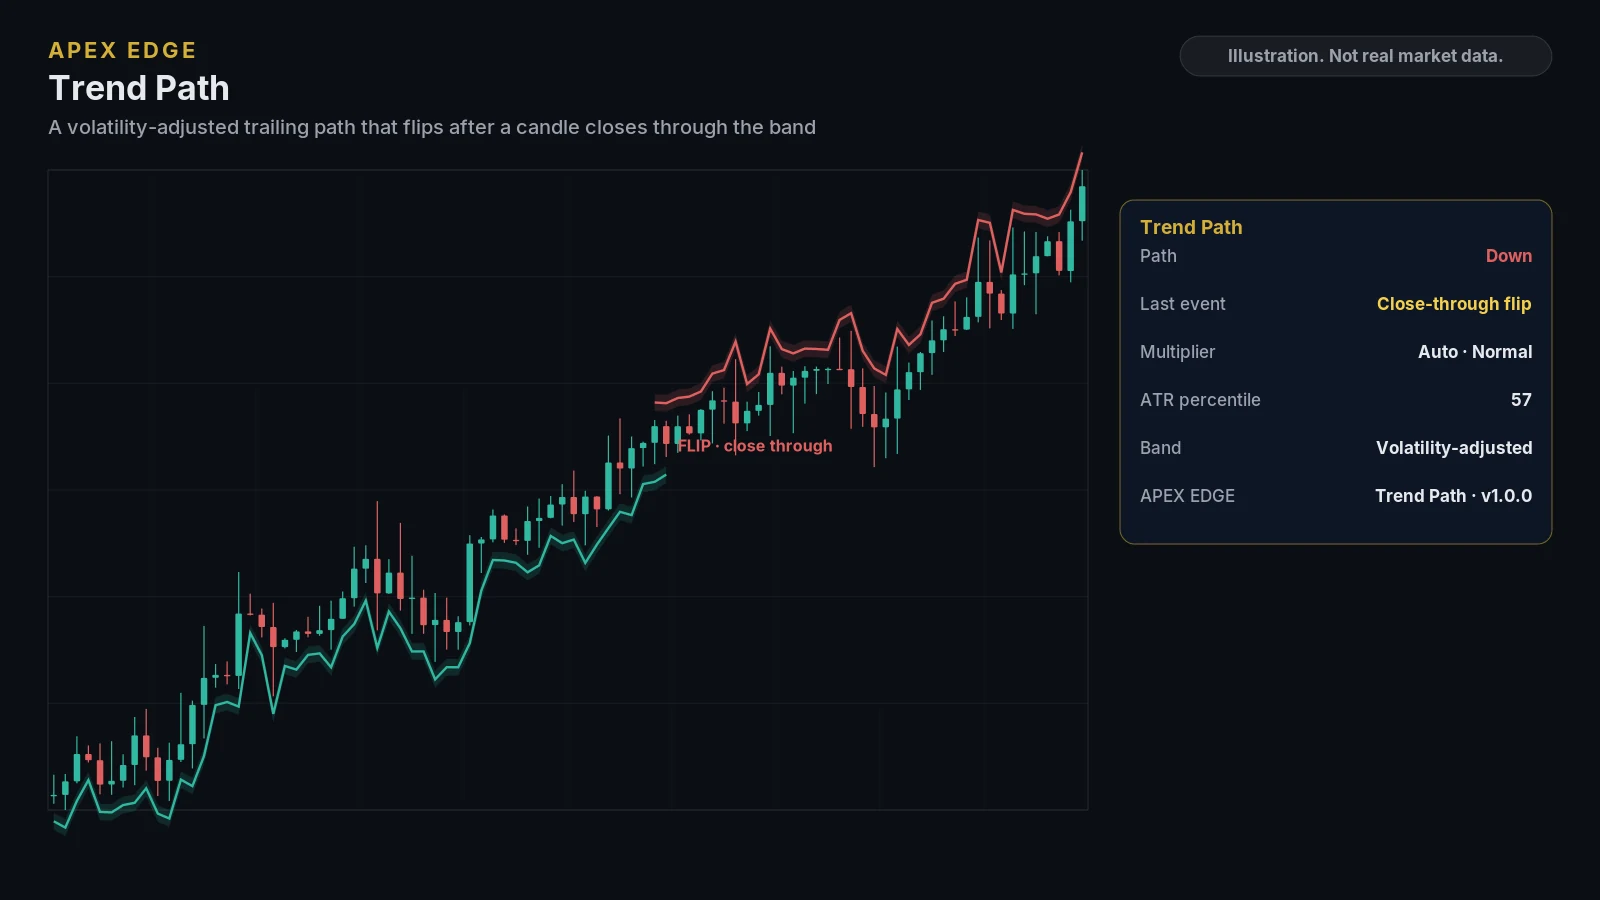
Illustrations drawn from sample data to show the layout. They are not real market data or TradingView screenshots. Education only, not personal advice.
Where to use itRecommended timeframe and markets
Any market, any timeframe
Works on any market. The optional higher-timeframe path defaults to the 4-hour chart and is built from that timeframe's last completed candle.
- Alerts fire once the candle closes when you use the Any alert() option or choose Once Per Bar Close. They are not a recommendation to place an order.
AlertsBuilt-in TradingView alerts
- Path turned up
- Path turned down
- HTF path turned up
- HTF path turned down
- 4 alert conditions in total, plus Any alert()
Alerts are created from the TradingView alert dialog. Alert availability depends on your TradingView plan.
CustomizeSettings you can adjust
- ATR length, fixed or Auto multiplier, and the Auto quiet / normal / expanded steps
- Fill and turn markers on or off
- Higher-timeframe path, timeframe and colors
- Path colors and line width
- Dashboard visibility, position, size and footer
Before you subscribeRequirements
- A TradingView account (TradingView is a third-party platform and is not affiliated with Apex Edge).
- Your TradingView username, entered at checkout, so access can be added to your account.
- A charting tool only: it does not place orders or connect to your broker.
Keep exploringOther indicators
Put clearer structure on your TradingView charts
Pick the indicators you need or take them all. Cancel any time on Whop, and learn how everything works for free in our lessons first.